Waveform Viewer
The waveform viewer has been rebuilt for SIMetrix and SIMetrix/SIMPLIS 8.2. It now operates faster, producers clearer plots and has a host of new features that both simplify and expand the user experience. Like the whole program update that came in version 8.0, the changes to the waveform viewer are such that experienced users of the previous waveform viewer will not have to significantly adapt to use the new viewer. Likewise, the waveform viewer remains fully compatible at the script language level.
New Drawing Engine
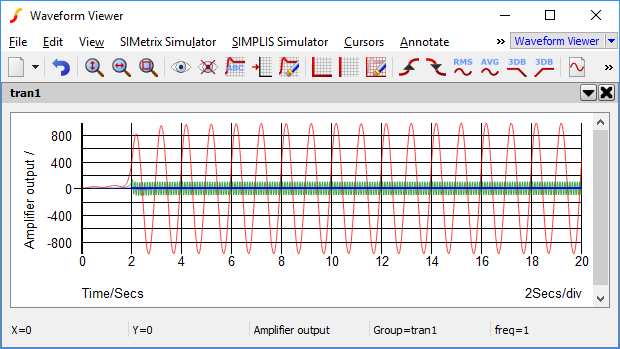
The underlying drawing engine for the waveform has been rebuilt, providing higher quality visuals and the draw times being significantly faster for large and multi-division curves.
An adaptive mechansim provides high quality smooth anti-aliased and semi-transparent curves for most waveforms, scaling back these features when speed is more important. This gives nice looking and easy to interpret waveforms, whilst allowing for large multi-run monte-carlo plots to be presented significantly faster than previous versions.
Multiple Axes
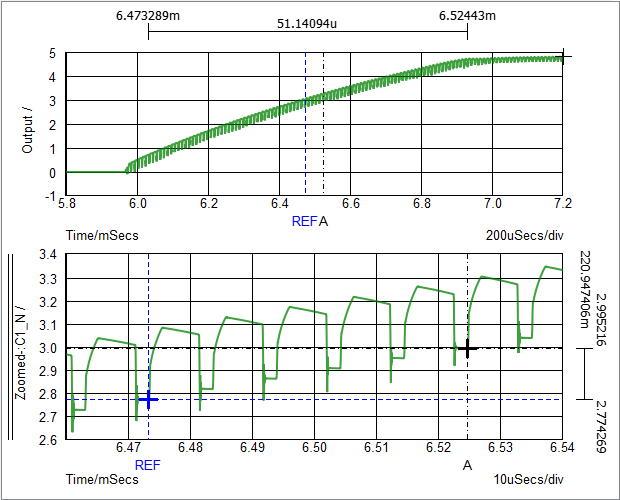
The new waveform viewer allows multiple x and y-axes to be displayed on the same sheet and plot.
This enables the ability to show multiple views of a plot on the same sheet, with different scales displayed on different x-axes. In doing so, you can view a zoomed in a small section of a curve, alongside the whole range of the simulation. Any cursors applied to the curve, will display and track in all of the different views at their correct locations.
Multiple x-axes also allow results from different types of analysis to be displayed on the same graph sheet. For example, an AC analysis can be shown together with a transient analysis, or a Fourier plot shown on the same sheet as its time domain equivalent.
Multiple y-axes can now be applied to all grids on the sheet.
Continuous x and y value display
A small cursor tracks displayed curves and shows the x and y values of the tracked curve in the status box. This makes it easier to find x and y values without switching on the main crosshair cursors. The small cursor also show division data for multi-step analyses. For example, if you so a swept analysis, the sweep value is displayed as you point to the curve.
Curve history
This replaces the persistence feature of the old viewer. Curves plotted from fixed probes on the schematic retain results from three previous plots. These can be displayed if desired.
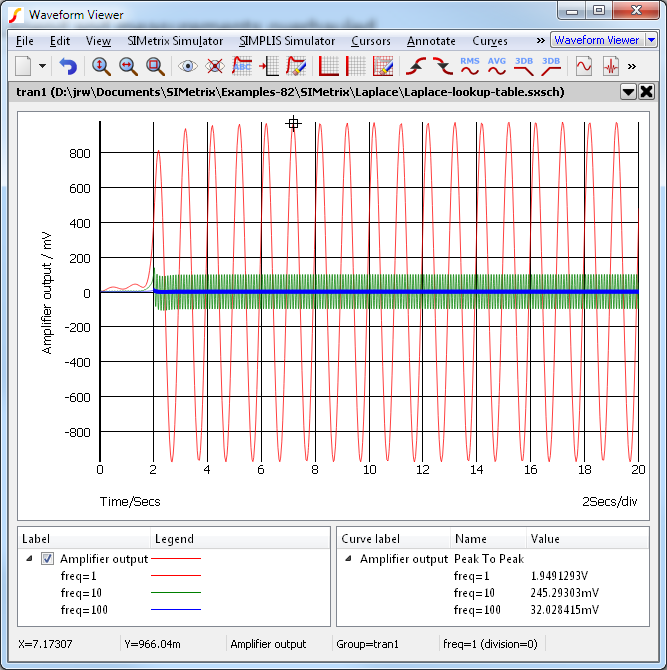
Legend and measurements overhauled
The legend display is now a tree structured display below the graph area. Multi-step curves are shown as a single legend which can be expanded to show each step. This makes large multi-step analyses more manageable. Measurements are shown in a separate panel. This also uses tree structure which treats multi-step curves as a single expandable entity. Monte Carlo plots now show statistics for measurements; in the old viewer the measurement of just the first analysis was shown. With the new viewer, minimum, maximum, mean and standard deviation are shown.
If a measurement is added to a curve that was created with a fixed probe, the measurement will be automatically updated on a new run. It isn’t necessary to specify the measurement with the probe.
At the script level measurements are graph objects with an id and properties just like curves and axes.
Curve Selection
Curves can now be selected by clicking on the curve itself.
Dedicated grid fixed probe option
There is now an option with fixed probes to specify that the curve have its own dedicated grid. This was possible to do with the old viewer but required that each curve be assigned a unique axis name.